
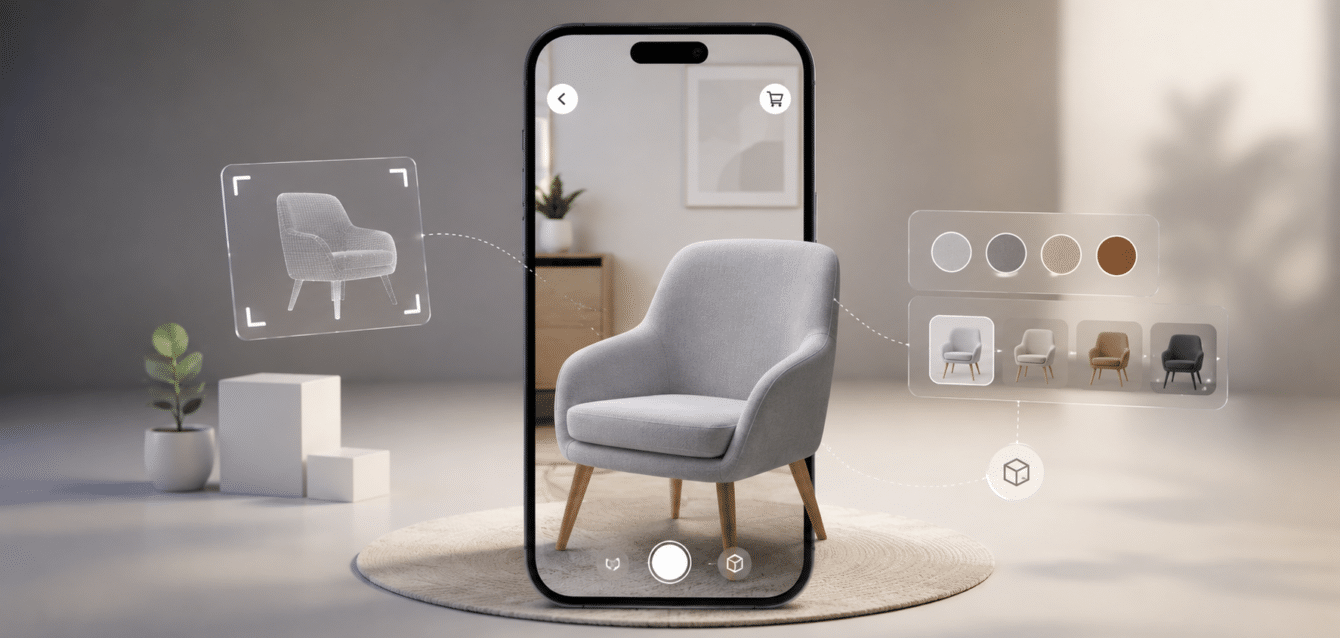
⚡ TL;DR — Quick AnswerAR product visualization is augmented reality technology that lets shoppers point their smartphone at their home, office, or body and see a photorealistic 3D model of a product placed there at accurate scale — before buying. US ecommerce and retail brands using AR product visualization report 35% lower return rates, 94% higher conversion among users who engage, and 2.4× higher average session time compared to standard product pages. Ink & Algorithm, based in Hanover Park, Illinois, builds custom AR product visualization solutions for US retail and ecommerce brands — WebAR with no app download, iOS AR Quick Look, Android Scene Viewer, and native AR app integrations for furniture, fashion, consumer electronics, home décor, and more.
Introduction
There is a version of online shopping that has frustrated buyers since the first ecommerce store launched: you look at a product photograph, you try to imagine how it will look in your space, you make an educated guess, you order — and when the product arrives, the color is slightly different under natural light, the scale is larger or smaller than you visualized, or the finish reads differently in context than it did on a white studio background. The return process starts. The brand absorbs the cost. And the buyer is slightly more cautious the next time they shop online for something they cannot see in person first.
AR product visualization eliminates this problem at its source. Instead of asking a buyer to imagine how a sofa will look in their living room, an AR visualization tool places that sofa — in the buyer’s exact color and material selection, at accurate scale — in their actual living room, through their smartphone camera, in real time. The guess is replaced by direct visual confirmation. The return risk is reduced at the moment of decision. And the buyer’s confidence in the purchase reaches a level that no product photography, zoom feature, or 360° spin can match.
In 2026, AR product visualization has crossed from a technology experiment into a commercial standard for US retail and ecommerce brands that sell products where visual context is the primary decision driver. The technology is mature, browser-based deployment has removed the app-download friction barrier, and the commercial ROI data is consistent across furniture, home décor, fashion, consumer electronics, and beauty categories. Ink & Algorithm has been building AR product visualization solutions for US brands from Hanover Park, Illinois — this guide covers every commercial and technical dimension that brands evaluating AR visualization need to make an informed decision.
Key Performance Data: AR Product Visualization in US Ecommerce
| 35%
Average return rate reduction across US retail brands using AR product visualization |
94%
Higher conversion rate for shoppers who engage with AR visualization vs standard product pages |
2.4×
Higher average session time on product pages with AR visualization |
61%
Of US online shoppers prefer retailers that offer AR try-before-you-buy experiences in 2026 |
What Is AR Product Visualization?
AR product visualization is the use of augmented reality technology to place a photorealistic 3D model of a product into the buyer’s real-world physical environment through a smartphone camera. The buyer sees their actual room, their actual desk, their actual face — and the product appears within that real space, correctly scaled, correctly lit by ambient light, responding to camera movement as if it were physically present. Every time the buyer selects a different color, material, or configuration option, the AR render updates to show that exact version in their space.
The key distinction from standard 3D product visualization (which shows a product rendered in a neutral studio environment) is the real-world context. A buyer seeing a product in their own environment — rather than a studio render — achieves a fundamentally different level of purchase confidence. This is the mechanism behind the documented return rate reductions and conversion lifts: the buyer is not guessing how the product will look in their space; they are seeing it there, before the transaction. Our 3D rendering vs product photography guide covers how 3D visualization and AR visualization compare to traditional photography approaches across commercial metrics.
How AR Product Visualization Works — Technical Overview
WebAR — Browser-Based, No App Required
WebAR is the deployment format that has driven mass adoption of AR product visualization in US retail. A buyer on a product page taps an ‘View in Your Room’ or ‘Try in AR’ button, their browser opens the device camera, and the AR product visualization launches immediately — no app store visit, no download, no account creation. The entire experience runs in the browser via WebXR and WebGL APIs. For US ecommerce brands, WebAR deployment means that 100% of mobile shoppers can access AR visualization without any installation barrier — the highest-friction moment in any AR adoption funnel is eliminated entirely.
Ink & Algorithm builds WebAR AR product visualization using 8th Wall, Model Viewer, and custom WebXR implementations — selecting the right technology based on the product category, required visual fidelity, and the brand’s ecommerce platform. Integration with Shopify, WooCommerce, Magento, and BigCommerce is built as a core deliverable — the AR visualization launches directly from the product page and passes configuration data (selected color, material, size) directly into the AR session. See our AR/VR/configurator integration guide for US retail for how these systems connect across a complete immersive commerce stack.
iOS AR Quick Look & Android Scene Viewer
For native-quality AR product visualization on mobile devices, Apple’s AR Quick Look (USDZ format) and Google’s Scene Viewer (GLB format) deliver OS-level AR experiences that leverage the full sensor suite of modern smartphones — LiDAR depth scanning on iPhone Pro models, plane detection, occlusion, and realistic shadow casting. When a buyer taps ‘View in AR’ from Safari on an iPhone, AR Quick Look launches in under two seconds with photorealistic object rendering and real-world shadow integration. Ink & Algorithm produces AR-optimized 3D assets in both USDZ and GLB formats for every AR product visualization project, ensuring maximum visual quality across the full iOS and Android user base.
Photorealistic 3D Asset Production
The visual quality of an AR product visualization experience is determined entirely by the quality of the underlying 3D asset. A low-polygon model with approximate materials looks unconvincing in AR — and an unconvincing AR visualization destroys buyer confidence rather than building it. Ink & Algorithm produces every AR product visualization 3D asset to production-grade PBR (Physically Based Rendering) specification — matching the actual material surface properties of the physical product (metal roughness, fabric weave, wood grain, leather texture, ceramic glaze) so the AR render is visually indistinguishable from the physical product in comparable lighting. The same 3D assets that power the AR visualization also power the product’s 3D spin view, the interactive configurator, and the 3D product animation content — one production investment generating multiple commercial touchpoints.
6 Product Categories Where AR Visualization Delivers Strongest US Market ROI
Furniture & Home Décor
Furniture AR product visualization is the category with the highest documented ROI — because furniture returns are both expensive to process and almost entirely caused by the expectation gap that AR closes. A buyer who places a sofa in their actual living room, sees it at accurate scale, confirms the color works with their existing rug and wall color, and sees how it fits the space — that buyer has zero visual uncertainty at checkout. Wayfair, IKEA, and Houzz all report that buyers who use AR are 11× more likely to purchase than those who don’t. Ink & Algorithm builds furniture AR visualization integrated with product configurators — the buyer configures fabric and finish, then places their configured piece in their room. See our how 3D configurators reduce returns data for the documented return rate impact across furniture categories.
Consumer Electronics & Technology
Electronics brands use AR product visualization to answer the spatial question that product photography cannot: will this television look right on that wall? Will this soundbar fit that shelf? Will this gaming chair work in that corner? Scale is the primary decision variable for large electronics, and AR visualization resolves scale concerns with a precision that dimensions in a spec sheet never can. For consumer electronics brands, the AR visualization also communicates finish quality — the difference between matte black and glossy black reads differently under the buyer’s actual room lighting than it does in a studio render, and AR shows the buyer exactly what they will see in their space.
Fashion & Apparel (Virtual Try-On)
Fashion AR product visualization takes the form of virtual try-on — where buyers see how a garment, accessory, shoe, or eyewear looks on their own body or face through the smartphone front or rear camera. For footwear, AR try-on overlays the shoe onto the buyer’s foot in real time, in their selected colorway. For eyewear, the buyer sees how frames look on their own face. For watches and jewelry, the AR visualization places the item on the buyer’s wrist or finger. US fashion brands report 30-40% lower return rates and 25% higher conversion for categories where virtual try-on is deployed. Ink & Algorithm’s AR services cover the full virtual try-on pipeline for fashion and accessories brands.
Home Improvement & Building Materials
Tile, flooring, paint, countertop, and cabinetry brands use AR product visualization to let buyers see how materials look in their actual kitchen, bathroom, or living space before ordering samples or committing to installation. A tile brand’s AR visualization tool places the selected tile pattern on the buyer’s actual floor — showing how the grout color, tile size, and laying pattern interact with the room’s existing lighting and adjacencies. This AR product visualization eliminates the sample-ordering step for many buyers, reducing the pre-purchase sales cycle from weeks to hours while increasing buyer confidence in their final selection.
Outdoor & Garden
Outdoor furniture, garden structures, and landscaping products present a specific visualization challenge — the buyer needs to see how a patio set, pergola, or garden sculpture fits in their actual outdoor space, which varies enormously in size, shape, and context. AR product visualization for outdoor categories uses the rear camera to place the selected product in the buyer’s actual garden or patio, at accurate scale, in their exact configuration. Our 3D configurators for outdoor furniture guide covers how AR and configurator integration work together for patio furniture brands specifically.
Sports & Fitness Equipment
Home fitness equipment — treadmills, exercise bikes, rowing machines, home gyms — presents the same scale uncertainty that furniture does: buyers need to know the equipment fits before they order. AR product visualization for fitness equipment places the selected machine in the buyer’s garage, basement, or spare room at accurate scale, allowing them to confirm clearance, position, and visual fit before committing to a large-ticket purchase. US fitness equipment brands report that AR visualization reduces the highest-cost return scenario — large equipment returned after delivery because it didn’t fit — by 40-50%.
“AR product visualization doesn’t replace the product. It replaces the guesswork. And in ecommerce, guesswork is what drives returns, abandoned carts, and the slow erosion of customer trust. Remove the guess, and the commercial outcome follows.”
— Ink & Algorithm, AR Product Visualization Practice
AR Product Visualization vs Standard Product Photography — Decision Guide
| Scenario | Standard Photography | AR Visualization |
|---|---|---|
| Buyer needs to judge product scale | Requires imagination — leads to returns | ✅ Accurate scale in buyer’s actual space |
| Product color decision | Studio lighting ≠ buyer’s ambient light | ✅ Rendered in buyer’s real lighting conditions |
| Space fit confirmation | Dimensions in spec sheet only | ✅ Physically placed in buyer’s room |
| Multiple colorway variants | Separate shoot per variant — expensive | ✅ Material swap in AR, no reshoot |
| Buyer confidence at checkout | Residual uncertainty = higher abandon | ✅ Visual certainty = lower abandon |
| Return rate impact | Baseline — imagination-driven returns | ✅ 35% average return reduction |
| Conversion rate impact | Baseline | ✅ 94% higher for AR users vs non-users |
| Social sharing potential | Standard product image | ✅ AR screenshots shared 2.4× more often |
Ecommerce Platform Integration — How Ink & Algorithm Connects AR to Your Store
Ink & Algorithm builds AR product visualization as integrated ecommerce infrastructure — not a standalone tool that buyers have to find. The AR visualization launches directly from the product page, passes the buyer’s current configuration selection (color, material, size) into the AR session, and sits alongside the product’s 3D web configurator and standard product gallery as a native part of the product page experience. Integration is built for the specific platform from day one:
| Platform | Integration Approach |
|---|---|
| Shopify & Shopify Plus | Model Viewer integration with AR Quick Look and Scene Viewer. Configuration data passed via URL parameters. One-tap AR from product page on all mobile devices. No app required. |
| WooCommerce | Custom AR button integration with 3D asset hosting via CDN. USDZ and GLB delivery based on device detection. Compatible with all major WooCommerce page builder themes. |
| Magento / Adobe Commerce | AR module development with native Magento product attribute mapping. Configuration option to AR model selection routing built into the product API layer. |
| BigCommerce | Headless BigCommerce with custom AR experience layer. Product variant to AR model mapping via BigCommerce catalog API. |
| Custom / Headless Ecommerce | Full custom AR implementation with client API integration. Supports any frontend framework (Next.js, Nuxt, custom React) with AR experience served via Ink & Algorithm’s CDN. |
Frequently Asked Questions
What is AR product visualization?
AR product visualization is augmented reality technology that places a photorealistic 3D model of a product into a buyer’s real-world environment through their smartphone camera — so they can see exactly how the product looks in their space, at accurate scale, before buying. It runs in the browser with no app download required (WebAR) or via native iOS/Android AR. Ink & Algorithm builds AR product visualization solutions for US ecommerce and retail brands from Hanover Park, Illinois.
How does AR product visualization reduce return rates?
AR product visualization reduces returns by eliminating the expectation gap — the difference between what a buyer imagined and what arrived. When a buyer has placed the actual product (in their selected color, material, and scale) in their own room before purchasing, they know exactly what they will receive. The primary driver of returns in furniture, home décor, and consumer electronics — ‘it looked different than I expected’ — is resolved before the transaction. US brands report 30-40% return rate reductions. Our 3D configurator returns reduction data guide covers the documented mechanisms across product categories.
Does AR product visualization require an app download?
No. Ink & Algorithm’s WebAR AR product visualization runs directly in the mobile browser — no app store visit, no download, no account. A buyer taps ‘View in AR’ on the product page, the browser opens the camera, and the AR visualization launches. On iPhone, iOS AR Quick Look launches natively from Safari. On Android, Scene Viewer launches natively from Chrome. The no-app requirement is critical for US ecommerce brands: removing the installation barrier means 100% of mobile shoppers can access AR visualization without friction.
Which US ecommerce categories benefit most from AR product visualization?
The strongest ROI for AR product visualization in the US market is in furniture and home décor (scale and fit uncertainty drives returns), consumer electronics (scale and finish judgment), fashion and footwear (try-on reduces size/fit returns), home improvement and building materials (seeing tile, flooring, and finishes in context), outdoor and garden furniture, and fitness equipment. These are all categories where visual context — specifically, seeing the product in the buyer’s actual space — is the primary decision variable. See Ink & Algorithm’s augmented reality services page for the full category scope.
How long does an AR product visualization project take?
A focused AR product visualization implementation — single product, WebAR deployment, Shopify or WooCommerce integration — delivers in 4–8 weeks from 3D asset sign-off. Multi-product AR launches with custom configurator integration span 10–16 weeks. Projects starting from scratch (3D asset production required) add 3–6 weeks for asset production. Contact Ink & Algorithm with your product range and platform for a scoped proposal within one business day.
Can AR product visualization connect to a 3D product configurator?
Yes — and this is the most commercially powerful AR product visualization deployment pattern: the buyer configures their product (selecting color, material, size) in the 3D web configurator, then launches the AR visualization to place their exact configured version in their room. The AR session shows the configured product — not a generic version. Ink & Algorithm builds this configurator-to-AR connection as a native integration, not a separate workflow. See our complete configurator development guide for the full scope of how configurator and AR integration works for US ecommerce brands.
The Bottom Line for US Retail & eCommerce Brands
AR product visualization has become the most commercially efficient investment available to US ecommerce brands that sell products where visual context determines whether a buyer commits or hesitates. The return rate reductions are documented, the conversion lifts are consistent, and the technology has matured to the point where browser-based AR visualization launches in seconds with no app required.
The brands capturing the most commercial value from AR product visualization in 2026 are those that have integrated it as a native part of the product page — connected to the product configurator, synced with inventory, and optimized for the specific product category’s decision drivers. Ink & Algorithm builds this full-stack AR product visualization infrastructure for US retail and ecommerce brands from Hanover Park, Illinois — delivered as a commercially purposeful tool, not a visual novelty.
Ready to Build AR Product Visualization for Your US eCommerce Brand?
Tell Ink & Algorithm about your product category, your current return rate, and your ecommerce platform.
Our team responds within one business day with a scoped AR visualization proposal.