
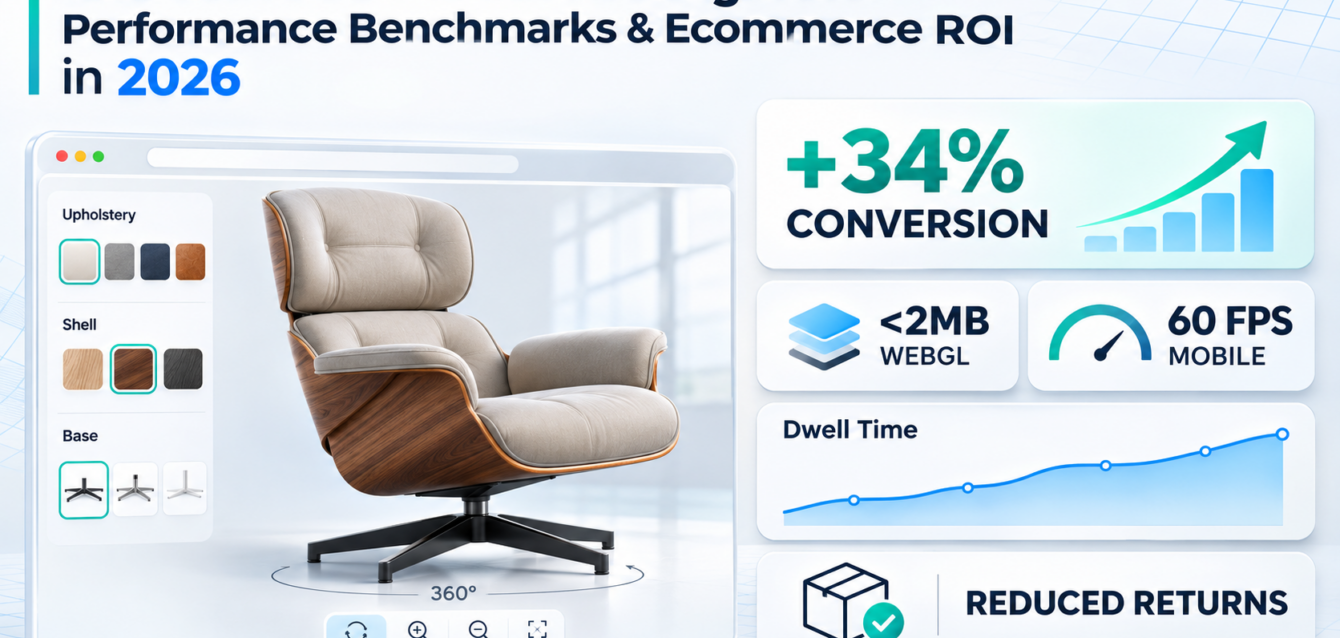
Interactive 3D product configurator benchmarks help ecommerce leaders separate measurable commercial performance from attractive demos. A credible benchmark combines conversion rate, asset weight, mobile frame rate, dwell time, return behavior, cart attachment and quoting velocity—then compares those metrics against a controlled baseline.
Claims such as a +34% conversion lift or a sub-2MB WebGL payload should be treated as performance targets and case-specific outcomes, not universal guarantees. Product complexity, traffic quality, implementation quality, pricing, device mix and the measurement window all influence results. The useful question is: what does a properly instrumented, high-performance 3D experience look like when every business and technical metric is visible?
Beyond Vanity Renders: Interactive Configuration vs Static 360 Spins
Direct answer: A static 360 spin lets shoppers rotate a fixed product, while a parametric WebGL configurator allows them to change finishes, components, dimensions and valid combinations in real time. The configurator creates stronger purchase intent because each interaction helps the buyer resolve a specific product decision.
Static renders can improve presentation, but they rarely answer complex questions about compatibility or personalization. A true configurator connects product rules to the visual layer. When a customer selects a material, accessory or dimension, the model, price and available options update together. That turns visualization into a buying tool rather than a passive asset.
The commercial difference appears in the journey. Track how many users launch the experience, change an option, save or share a configuration, add the configured item to cart and complete checkout. Those actions reveal whether the experience is reducing uncertainty. Ink & Algorithm’s interactive 3D product configurator development approach connects visual quality with configuration logic, commerce data and measurable conversion events.
Speed Equals Revenue: What Sub-2MB and 60 FPS Mean
Direct answer: A sub-2MB initial 3D payload is a practical performance budget for many optimized ecommerce scenes, while 60 FPS is a smoothness target on capable mobile devices. Together they reduce waiting and interaction friction, but they require geometry cleanup, Draco compression, KTX2 textures, staged loading and device testing.
The payload target should apply to the first useful state, not every optional asset in the configurator. Load a lightweight default model, essential materials and the minimum interface first. Additional colors, accessories, close-up textures and high-detail geometry can stream after interaction. This keeps the primary page responsive and protects Core Web Vitals.
Frame rate is equally important. A small file can still perform poorly if it contains too many draw calls, expensive transparent materials, real-time shadows or uncontrolled state updates. Test on iOS Safari and representative mid-tier Android hardware. Monitor long tasks, memory pressure, thermal throttling and the stability of interaction—not only desktop benchmarks.
A +34% conversion result is meaningful only when the experiment is defined. Compare equivalent audience segments, run the test long enough to cover purchase cycles and separate configurator users from non-users. The most defensible calculation is: (configurator conversion rate − baseline conversion rate) ÷ baseline conversion rate × 100. For example, an increase from 3.0% to 4.02% is a 34% relative lift, not a 34-percentage-point gain.
For the engineering workflow behind fast assets, see our guide to CAD-to-WebGL optimization and the 3D configurator Core Web Vitals checklist.
Dwell Time and Return Reduction: Measure Decision Quality
Direct answer: Longer dwell time is valuable only when it reflects productive inspection and configuration. Measure it alongside option changes, dimension views, saved configurations and completed purchases. Return-rate reductions of 20% to 35% can be realistic targets in mismatch-prone categories, but they must be validated against product-specific return reasons.
Interactive 3D can reduce expectation gaps by showing scale, proportions, materials and permitted combinations before checkout. Furniture shoppers can inspect finishes and dimensions; footwear buyers can compare colorways; industrial buyers can validate components and access clearances. Accurate visualization helps, but it does not replace sizing guidance, calibrated color workflows or complete product information.
Segment returns by reason code. If returns fall because “item not as expected,” “wrong finish” or “incompatible option” declines, the configurator may be improving decision quality. If logistics damage or fulfillment errors dominate, a visual tool will not solve the underlying issue. This is why ROI reporting should connect interaction data with order and return data rather than relying on engagement alone.
Read more about reducing ecommerce returns with interactive 3D.
Checkout and CPQ Velocity: From Configuration to Revenue
Direct answer: In ecommerce, measure whether configured products reach the cart and checkout at a higher rate. In B2B, measure how quickly a valid configuration becomes a quote, BOM or CRM opportunity. The strongest systems preserve product rules and configuration IDs across every handoff.
For Shopify Plus, the configurator should pass selected variants, price adjustments, personalization data and a configuration reference into the native cart. Track cart attachment rate, checkout initiation and completed revenue for sessions that used the configurator. Compare these with non-configurator sessions while controlling for traffic source, device and product category.
For manufacturing and B2B sales, connect visual configuration to CPQ, ERP and CRM workflows. Useful benchmarks include quote turnaround time, number of manual revisions, invalid combination rate, sales-engineering hours per quote and time from qualified opportunity to approved proposal. A visual CPQ experience creates value when it accelerates a valid decision—not merely when it generates more clicks.
Our guide to product configurator integration with ERP, CRM and CPQ explains the data handoffs behind this workflow.
Benchmarking Your Store: Four GA4 Events to Track
Direct answer: Track configurator launch, meaningful configuration changes, configured add-to-cart and completed lead or purchase outcomes. These four event groups create a clean funnel from interest to commercial value and make it possible to compare conversion quality by landing page, channel, device and product.
1. configurator_launched
Fire this once when the 3D experience becomes usable, not when the page merely loads. Include product ID, product category, device class and experience version.
2. configuration_changed
Record a meaningful option change and include option type, selected value and configuration ID. Avoid firing excessive events for camera movement or every rendered frame.
3. configured_add_to_cart
Trigger when a configured product enters the cart. Pass product ID, configuration ID, price, currency and selected variant count so cart attachment can be tied to actual configuration behavior.
4. configurator_conversion
Use this for the final business outcome: purchase, qualified lead, saved quote or booked consultation. Include revenue or estimated pipeline value when governance allows. Mark the relevant outcome as a GA4 key event.
A Practical 2026 Benchmark Scorecard
- Initial 3D payload: target under 2MB where product complexity permits.
- Interaction performance: target a stable 50–60 FPS on representative mobile hardware.
- Launch rate: percentage of eligible product-page sessions that start the configurator.
- Completion rate: percentage of launched sessions that make a meaningful configuration.
- Configured cart rate: configured add-to-cart events divided by configurator launches.
- Relative conversion lift: configurator cohort conversion compared with a controlled baseline.
- Return-rate change: compare matched products and reason codes before and after launch.
- B2B quote velocity: time from configuration start to valid quote or proposal.
Turn Benchmarks Into a Business Case
A 3D configurator business case should connect performance engineering to revenue. Start with baseline conversion, average order value, annual qualified traffic, return cost and quoting labor. Model conservative, expected and aggressive scenarios instead of presenting one headline number as a guarantee.
Ink & Algorithm designs WebGL configurators around measurable outcomes: lightweight asset pipelines, mobile performance, Shopify Plus commerce flows, enterprise CPQ rules and analytics-ready events. If you need a benchmark plan for your product catalog, request a 3D configurator strategy and performance review.