

TL;DR: B2B Product Configurator ROI — Manufacturers Calculate Payback. Learn about costs, features, ROI, and how US brands use this technology in 2026.
B2B product configurator ROI comes from more than an attractive 3D experience. For manufacturers, the strongest return is usually created by faster quoting, fewer configuration errors, reduced engineering effort, shorter sales cycles, and better-qualified opportunities. The challenge is converting those improvements into a business case that finance, sales, engineering, and leadership can evaluate.
This 2026 guide explains how US manufacturers can calculate product configurator ROI, choose meaningful metrics, estimate payback, and avoid inflated projections.
What Is a B2B Product Configurator?
A B2B product configurator is an interactive application that helps a buyer, salesperson, dealer, or engineer select valid product options. It can guide users through features, dimensions, materials, accessories, performance requirements, and compatibility rules. Advanced configurators may also generate pricing, drawings, bills of materials, proposal documents, or CRM records.
A visual 3D configurator adds a real-time product representation so users can see changes as they make selections. For complex products, this visual feedback can make technical options easier to understand and reduce uncertainty before a quote.
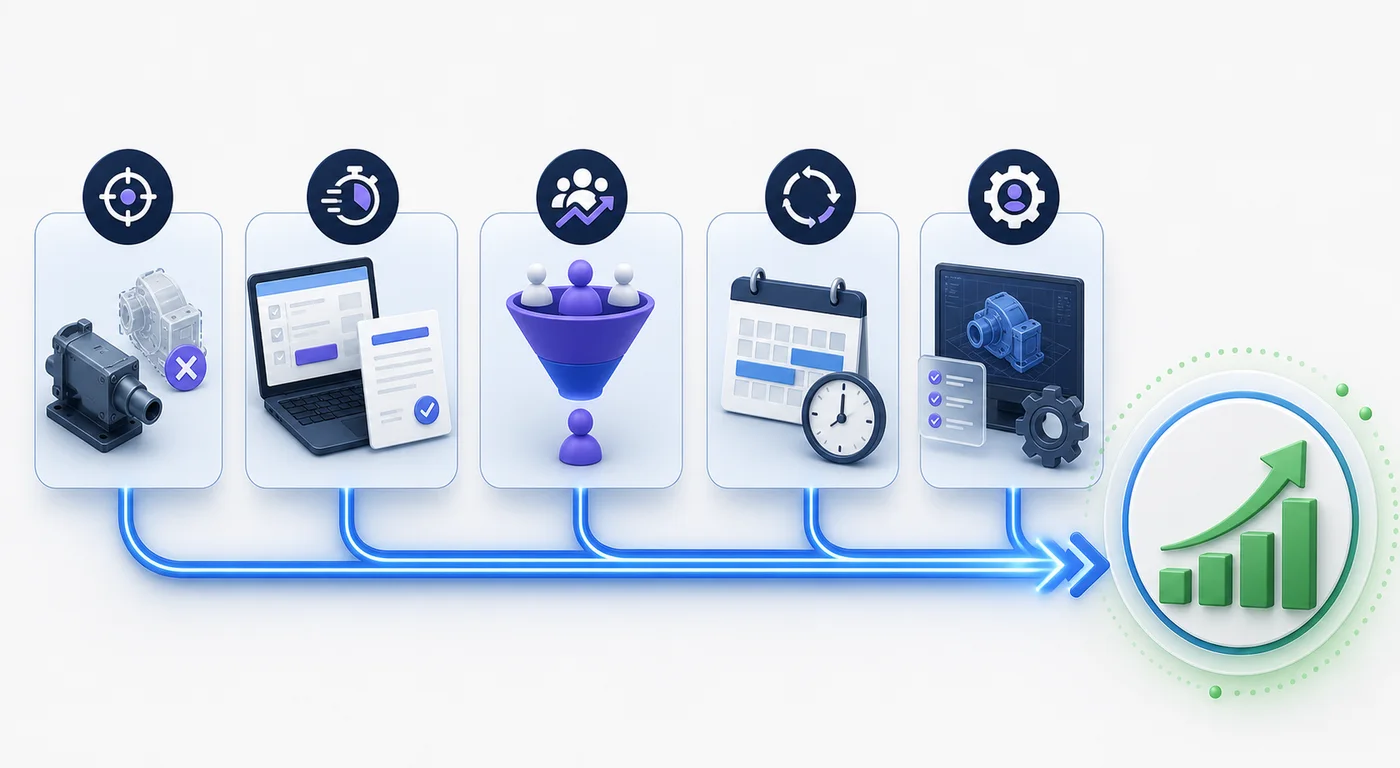
Where Product Configurator ROI Comes From
Configurator value normally appears across several departments rather than one isolated metric:
- Sales: faster discovery, configuration, and proposal preparation.
- Engineering: fewer repetitive requests and invalid custom combinations.
- Operations: cleaner order data and fewer corrections.
- Marketing: higher engagement and stronger product education.
- Customers: greater confidence, transparency, and self-service.
The business case should identify which benefits are measurable for your specific workflow instead of assuming every possible advantage will occur.
The Product Configurator ROI Formula
A simple starting formula is:
ROI = (Annual Financial Benefit − Annual Operating Cost) ÷ Total Investment × 100
Payback period can be estimated as:
Payback Period = Total Investment ÷ Monthly Net Benefit
Total investment should include discovery, UX design, 3D asset preparation, business rules, software development, integrations, testing, training, launch, and internal project time. Operating cost should include hosting, support, updates, content management, analytics, and future product changes.
1. Measure Time Saved on Quotes
Start with the current quote process. Track how long sales, engineering, and operations spend on a typical configuration and proposal. Include clarification emails, drawing requests, pricing approvals, and corrections—not only the final document creation.
If a company produces 500 quotes per year, saves two staff hours per quote, and uses a blended labor cost of $70 per hour, the estimated annual labor value is:
500 × 2 × $70 = $70,000 per year
Use actual process data when possible. A short time study across several representatives is more credible than one optimistic estimate.
2. Calculate the Cost of Configuration Errors
Invalid combinations and incomplete order details create rework. In severe cases, they can produce incorrect parts, delayed installation, returns, or customer concessions. Estimate:
- How many configuration-related errors occur each year
- Average engineering and sales rework per error
- Production, shipping, or field-service cost
- Revenue delayed or lost because of corrections
A rules-driven configurator may not eliminate every error, but it can prevent combinations that violate known product logic and require mandatory information before a quote proceeds.
3. Value Reduced Engineering Support
Sales teams often rely on application engineers for routine feasibility checks, drawings, and option selection. A configurator can encode repeatable knowledge and reserve engineering time for genuinely complex opportunities.
Measure the monthly hours engineering spends on standard sales support, then estimate the portion that the application can reliably automate. Avoid assigning a financial benefit to every saved hour unless that capacity will be used for higher-value work or reduces future hiring needs.
4. Estimate Conversion Improvement
Interactive visualization can help buyers understand a product, compare options, and commit to a specification. However, conversion lift should be treated carefully because many other factors influence a sale.
Use a baseline conversion rate for qualified opportunities and test the configurator with comparable traffic, territories, or sales teams. Calculate incremental gross profit—not total revenue—when estimating financial return.
For ecommerce and product-led experiences, interactive 3D may also increase engagement. Learn how visual assets support buying decisions in this guide to 3D product visualization for online stores.
5. Measure Sales-Cycle Reduction
A configurator can shorten the time between initial discovery and an approved specification. Faster cycles may improve capacity, forecasting, and win rate. Track median days from qualified opportunity to quote and from quote to order before and after launch.
The financial value of speed depends on the business. A shorter cycle can allow a salesperson to manage more opportunities, bring revenue forward, reduce follow-up effort, or lower the chance that a project loses momentum.
6. Include Dealer and Distributor Efficiency
For channel-led manufacturers, a configurator can provide partners with consistent product logic, visual guidance, and current options. Potential benefits include fewer support calls, faster dealer onboarding, more accurate requests, and better brand presentation.
Measure partner adoption separately. A technically strong tool will not create ROI if distributors continue using spreadsheets and PDFs because the new workflow is difficult or incomplete.
7. Account for Reusable 3D Assets
Well-prepared product models can support the configurator, rendered images, animation, AR, training, and future campaigns. Reuse can improve the return on the 3D asset investment, provided geometry, materials, naming, and variants are planned for multiple outputs.
Do not count the full value of every possible reuse in the initial ROI case. Include only approved, budgeted uses to keep the calculation credible.
What Costs Should Be Included?
- Product and workflow discovery
- User experience and interface design
- CAD cleanup and real-time 3D optimization
- Configuration rules and dependency mapping
- Front-end and back-end development
- CPQ, CRM, ERP, ecommerce, or pricing integrations
- Quality assurance and device testing
- Content entry, training, and change management
- Hosting, analytics, security, and support
- Product updates and new option maintenance
The lowest development quote is not necessarily the lowest total cost. A configurator that is difficult to update or poorly integrated can create an expensive maintenance burden.
Example B2B Configurator ROI Calculation
Consider a manufacturer investing $180,000 in a configurator, with $30,000 in annual operating and update costs. Conservative annual benefits might include:
- $70,000 from faster quote preparation
- $55,000 from reduced engineering support
- $35,000 from fewer configuration errors
- $50,000 in incremental gross profit from improved conversion
Total annual benefit is $210,000. Net annual benefit after operating cost is $180,000.
First-year ROI = ($210,000 − $30,000 − $180,000) ÷ $180,000 = 0%
The initial investment is recovered during the first year. In year two, assuming the same benefit and operating cost, net benefit is approximately $180,000. A multi-year model provides a clearer view than emphasizing first-year ROI alone.
Metrics to Track After Launch
- Configurator start and completion rate
- Time to valid configuration
- Quote preparation time
- Percentage of quotes requiring engineering review
- Configuration error and correction rate
- Opportunity-to-quote and quote-to-order conversion
- Median sales-cycle length
- Average order value and gross margin
- Dealer, salesperson, and customer adoption
- Performance, device errors, and abandonment points
Define metric ownership before launch. Analytics data is useful only when someone reviews it and improves the experience.
How to Build a Credible Business Case
- Map the current process. Document people, tools, handoffs, delays, and errors.
- Establish baselines. Measure current quote time, engineering hours, error rate, and conversion.
- Choose conservative assumptions. Separate proven savings from potential upside.
- Model three scenarios. Use conservative, expected, and high-adoption cases.
- Include adoption. Apply realistic usage rates across sales teams and partners.
- Calculate three-year value. Include operating cost and product updates.
- Plan measurement. Decide how the organization will validate each benefit after launch.
Common ROI Mistakes
- Counting revenue instead of incremental gross profit
- Assuming 100% adoption immediately
- Ignoring internal implementation time
- Excluding integrations and ongoing updates
- Assigning value to saved hours that cannot be redeployed
- Using conversion claims from unrelated industries
- Launching without baseline measurements
When a Product Configurator Is Not the Right Investment
A configurator may not be justified when products have few meaningful options, sales volume is low, rules change constantly, source data is unreliable, or every order requires unique engineering. In these cases, better product content, guided forms, animation, or a simpler selection tool may create faster value.
The best candidates have repeatable product logic, enough quote volume, measurable friction, and stakeholders willing to maintain product data.
Frequently Asked Questions
How long does a B2B product configurator take to build?
A focused configurator may take three to five months. Complex CPQ logic, large product families, custom pricing, or enterprise integrations can require six to twelve months or more.
What is a good payback period?
Many businesses target payback within 12 to 24 months, but the acceptable period depends on strategic value, risk, and internal investment criteria.
Does a 3D configurator always improve conversion?
No. Results depend on product fit, traffic quality, usability, performance, pricing clarity, and the surrounding sales process. Test against a baseline.
Should engineering own the configurator?
Ownership is usually shared. Product, sales, engineering, marketing, IT, and operations should define governance, while one accountable business owner manages priorities.
How often should ROI be reviewed?
Review adoption and workflow metrics monthly after launch, then evaluate financial results quarterly. Update the model when product scope or integrations change.
Turn Configuration Friction into Measurable Value
A strong configurator business case connects technical capabilities to measurable workflow improvements. Ink & Algorithm helps businesses design web-based 3D configurators that make complex products easier to understand, configure, and sell. Start with real baseline data, build conservative scenarios, and measure results after launch.
Ready to get started? Contact Ink & Algorithm to discuss your project—we’ll help you create results that drive sales.
Cost & Pricing
| Service | Cost Range | Timeline |
|---|---|---|
| Basic package | $5,000-$15,000 | 2-4 weeks |
| Standard package | $15,000-$50,000 | 4-8 weeks |
| Premium package | $50,000-$150,000+ | 8-16 weeks |